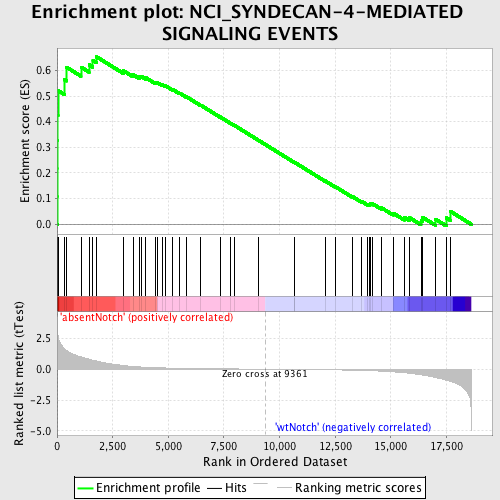
Profile of the Running ES Score & Positions of GeneSet Members on the Rank Ordered List
| Dataset | Set_03_absentNotch_versus_wtNotch.phenotype_absentNotch_versus_wtNotch.cls #absentNotch_versus_wtNotch.phenotype_absentNotch_versus_wtNotch.cls #absentNotch_versus_wtNotch_repos |
| Phenotype | phenotype_absentNotch_versus_wtNotch.cls#absentNotch_versus_wtNotch_repos |
| Upregulated in class | absentNotch |
| GeneSet | NCI_SYNDECAN-4-MEDIATED SIGNALING EVENTS |
| Enrichment Score (ES) | 0.6526832 |
| Normalized Enrichment Score (NES) | 1.6751753 |
| Nominal p-value | 0.0035587188 |
| FDR q-value | 0.24032864 |
| FWER p-Value | 0.512 |
| PROBE | DESCRIPTION (from dataset) | GENE SYMBOL | GENE_TITLE | RANK IN GENE LIST | RANK METRIC SCORE | RUNNING ES | CORE ENRICHMENT | |
|---|---|---|---|---|---|---|---|---|
| 1 | CXCR4 | 4590519 | 22 | 3.106 | 0.1093 | Yes | ||
| 2 | SDC4 | 6370411 | 26 | 3.068 | 0.2183 | Yes | ||
| 3 | PTK2 | 1780148 | 28 | 3.004 | 0.3252 | Yes | ||
| 4 | ITGB1 | 5080156 6270528 | 36 | 2.818 | 0.4250 | Yes | ||
| 5 | CCL5 | 3710397 | 42 | 2.710 | 0.5212 | Yes | ||
| 6 | GNG2 | 2230390 | 332 | 1.627 | 0.5635 | Yes | ||
| 7 | GNB1 | 2120397 | 426 | 1.508 | 0.6121 | Yes | ||
| 8 | GNAS | 630441 1850373 4050152 | 1074 | 0.997 | 0.6128 | Yes | ||
| 9 | RAC1 | 4810687 | 1437 | 0.806 | 0.6219 | Yes | ||
| 10 | WNT6 | 4570364 | 1611 | 0.723 | 0.6383 | Yes | ||
| 11 | TFPI | 1400288 5550008 | 1776 | 0.652 | 0.6527 | Yes | ||
| 12 | MMP9 | 580338 | 2972 | 0.298 | 0.5989 | No | ||
| 13 | ADAM12 | 3390132 4070347 | 3420 | 0.224 | 0.5828 | No | ||
| 14 | FGFR1 | 2190095 4570161 | 3695 | 0.189 | 0.5748 | No | ||
| 15 | FZD7 | 7050706 | 3777 | 0.178 | 0.5768 | No | ||
| 16 | PLCG1 | 6020369 | 3983 | 0.160 | 0.5714 | No | ||
| 17 | TNC | 670053 1780039 1980020 3060411 4780091 6860433 | 4432 | 0.125 | 0.5517 | No | ||
| 18 | CSNK1A1 | 2340427 | 4506 | 0.119 | 0.5521 | No | ||
| 19 | FZD3 | 1500397 | 4728 | 0.106 | 0.5439 | No | ||
| 20 | MAP3K7 | 6040068 | 4873 | 0.099 | 0.5397 | No | ||
| 21 | PRKCD | 770592 | 5186 | 0.086 | 0.5260 | No | ||
| 22 | SDCBP | 460487 2190039 5270441 | 5516 | 0.073 | 0.5108 | No | ||
| 23 | ITGA5 | 5550520 | 5820 | 0.064 | 0.4968 | No | ||
| 24 | CAMK2A | 1740333 1940112 4150292 | 6459 | 0.047 | 0.4641 | No | ||
| 25 | WNT4 | 4150619 | 7325 | 0.030 | 0.4186 | No | ||
| 26 | NLK | 2030010 2450041 | 7808 | 0.022 | 0.3935 | No | ||
| 27 | PLG | 3360270 3840100 | 7965 | 0.020 | 0.3858 | No | ||
| 28 | FZD6 | 360288 | 9067 | 0.004 | 0.3266 | No | ||
| 29 | LAMA3 | 1190131 5290239 | 10660 | -0.019 | 0.2416 | No | ||
| 30 | LAMA1 | 1770594 | 10670 | -0.019 | 0.2417 | No | ||
| 31 | YES1 | 6100050 | 12042 | -0.044 | 0.1695 | No | ||
| 32 | FGF2 | 3450433 | 12518 | -0.055 | 0.1459 | No | ||
| 33 | WNT11 | 1230278 | 13272 | -0.080 | 0.1082 | No | ||
| 34 | FN1 | 1170601 2970647 6220288 6940037 | 13693 | -0.099 | 0.0891 | No | ||
| 35 | THBS1 | 4560494 430288 | 13959 | -0.114 | 0.0788 | No | ||
| 36 | NFATC2 | 70450 540097 | 14044 | -0.118 | 0.0785 | No | ||
| 37 | CXCL12 | 580546 4150750 4570068 | 14067 | -0.120 | 0.0816 | No | ||
| 38 | F2 | 5720280 | 14186 | -0.127 | 0.0798 | No | ||
| 39 | MDK | 3840020 | 14580 | -0.158 | 0.0642 | No | ||
| 40 | WNT5A | 840685 3120152 | 15104 | -0.211 | 0.0436 | No | ||
| 41 | RHOA | 580142 5900131 5340450 | 15606 | -0.287 | 0.0268 | No | ||
| 42 | TNFRSF13B | 1990373 | 15827 | -0.325 | 0.0265 | No | ||
| 43 | PRKCA | 6400551 | 16357 | -0.456 | 0.0143 | No | ||
| 44 | GIPC1 | 4590348 5570438 5900707 | 16412 | -0.471 | 0.0281 | No | ||
| 45 | CDC42 | 1240168 3440278 4480519 5290162 | 17003 | -0.666 | 0.0201 | No | ||
| 46 | MAP3K7IP1 | 2120095 5890452 6040167 | 17497 | -0.889 | 0.0252 | No | ||
| 47 | DNM2 | 50176 3170279 | 17672 | -0.985 | 0.0508 | No |

